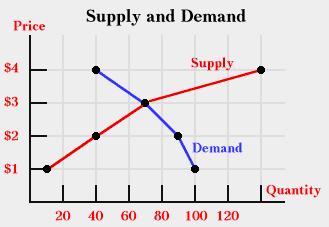
The Graph above represents both supply and demand. The red line is supply while the blue stands for demand. Every time prices of production increase, the quantity of the product also increases for the supply line. Every time prices go down on the demand line, the quantity goes up because it motivates consumers to buy more of a cheap products.
Change in quantity supplied

Change in quantity demanded( increase in demand)

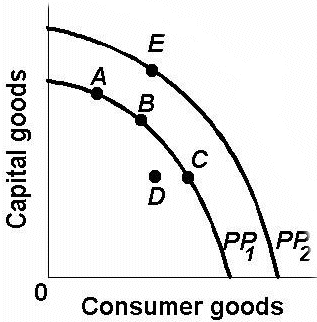
The production possibilities frontier is the rate of production an economy can produce efficiently over a specific period of time with limited quantity of factors of production

No hay comentarios:
Publicar un comentario